

What is Grafana Cloud?
Grafana Alerting allows you to learn about problems in your systems moments after they occur. Create, manage, and take action on your alerts in a single, consolidated view, and improve your team’s ability to identify and resolve issues quickly.
Grafana Alerting is available for Grafana OSS, Grafana Enterprise, or Grafana Cloud. With Mimir and Loki alert rules you can run alert expressions closer to our data and at massive scale, all managed by the Grafana UI you are already familiar with.
Task-01
Setup Grafana cloud
Setup sample alerting
Solution
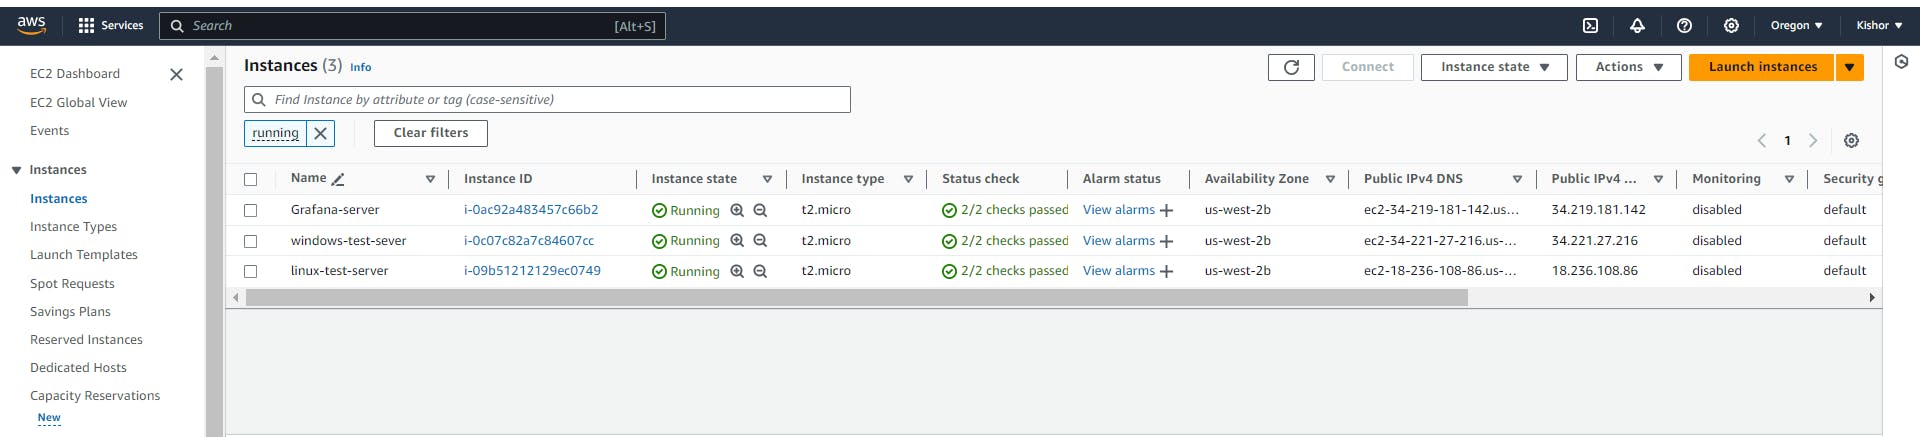
Step 1: Launch 2 ec2 instance for windows and Linux server.
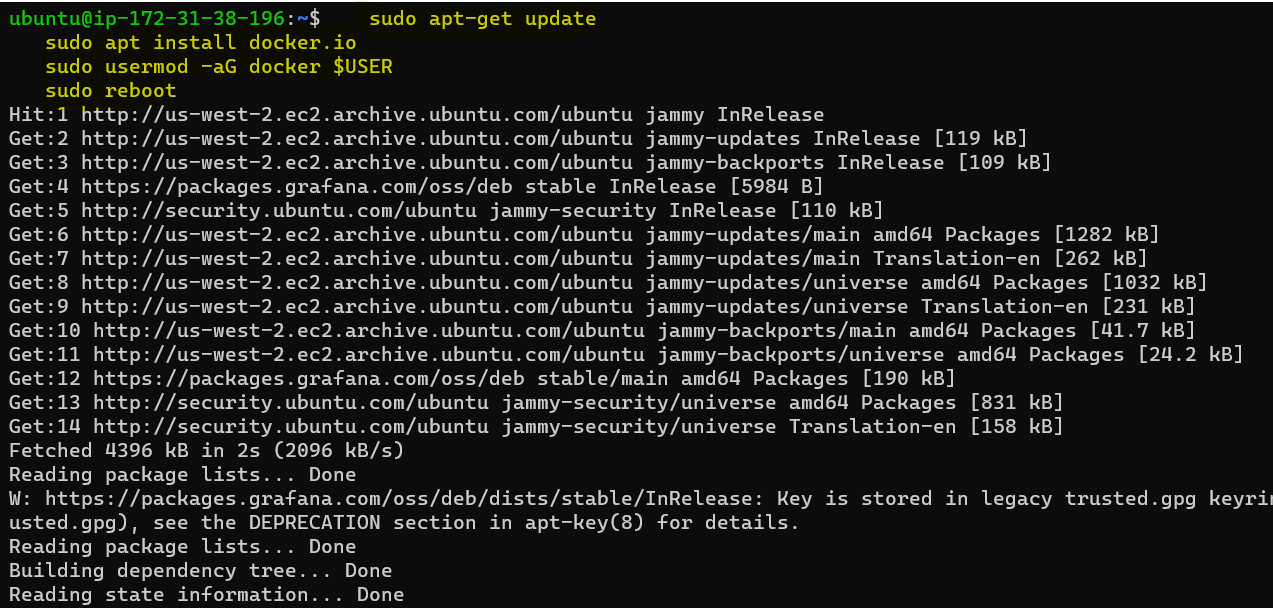
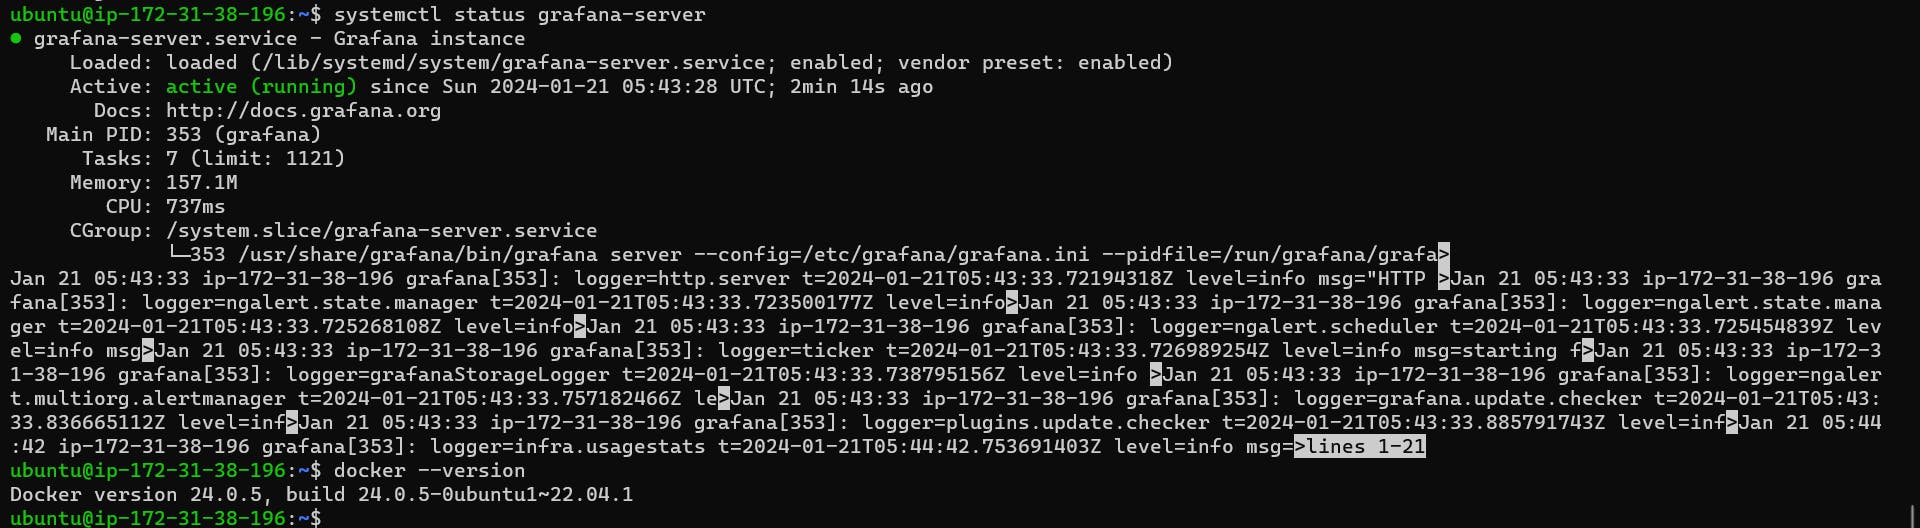
As perquisite we need to Install docker on grafana instance.
Step 2: Lets Install Loki and promtail on grafana server using docker container.
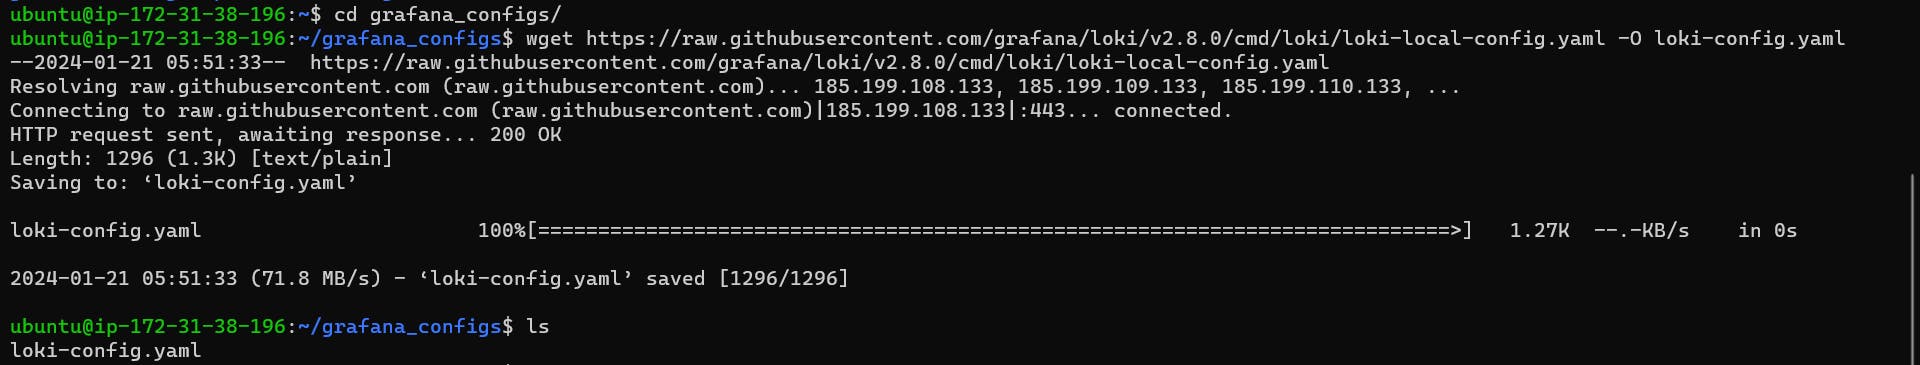
for Loki we need to download config file with below command
COPY
COPY
  mkdir grafana_configs
  cd grafana_configs
  wget https://raw.githubusercontent.com/grafana/loki/v2.8.0/cmd/loki/loki-local-config.yaml -O loki-config.yaml
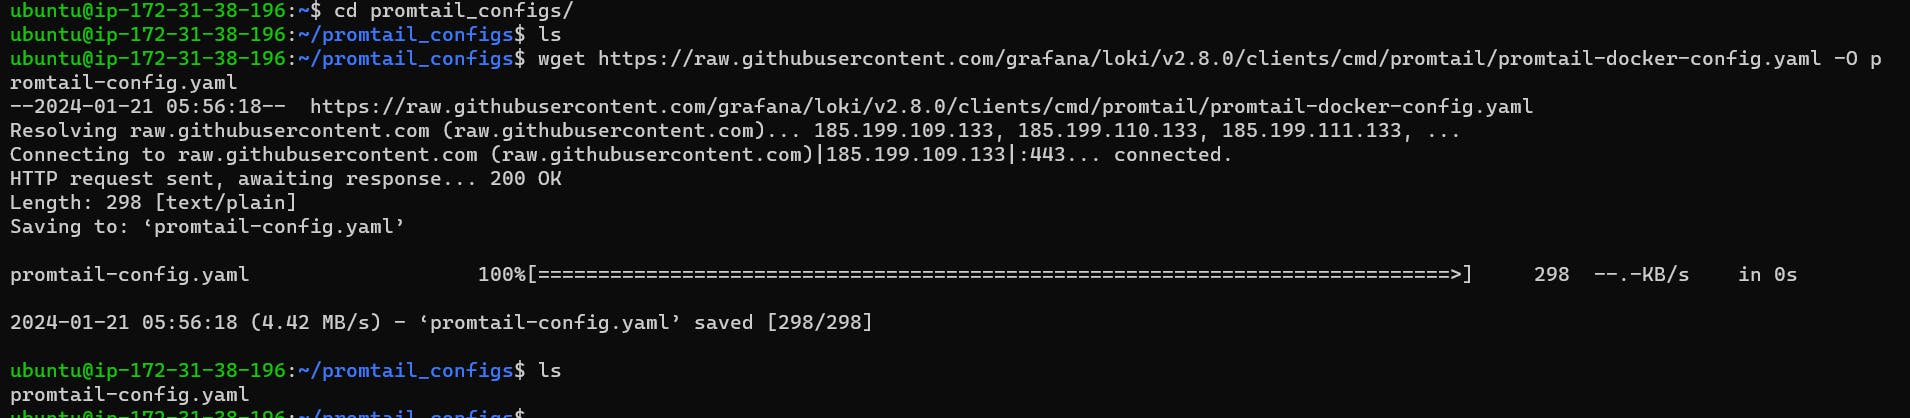
same way we can download config for promtails.
COPY
COPY
  mkdir promtail_configs
  cd promtail_configs
  wget https://raw.githubusercontent.com/grafana/loki/v2.8.0/clients/cmd/promtail/promtail-docker-config.yaml -O promtail-config.yaml
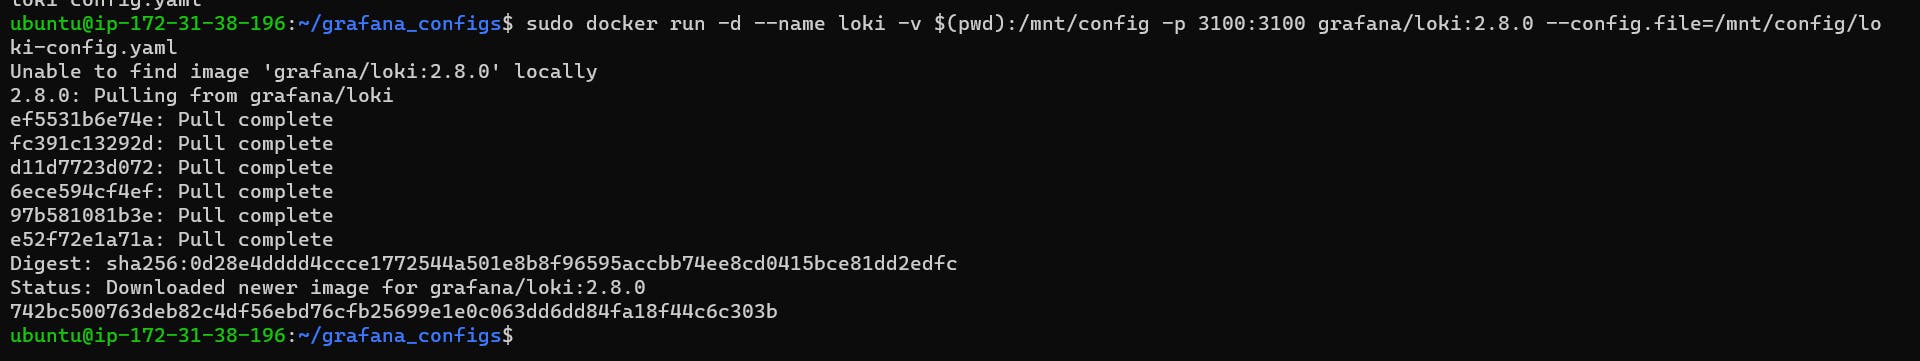
Will run docker container for both loki and promtail
Loki
sudo docker run -d --name loki -v $(pwd):/mnt/config -p 3100:3100 grafana/loki:2.8.0 --config.file=/mnt/config/loki-config.yaml
Promtail
sudo docker run -d --name promtail -v $(pwd):/mnt/config -v /var/log:/var/log --link loki grafana/promtail:2.8.0 --config.file=/mnt/config/promtail-config.yaml

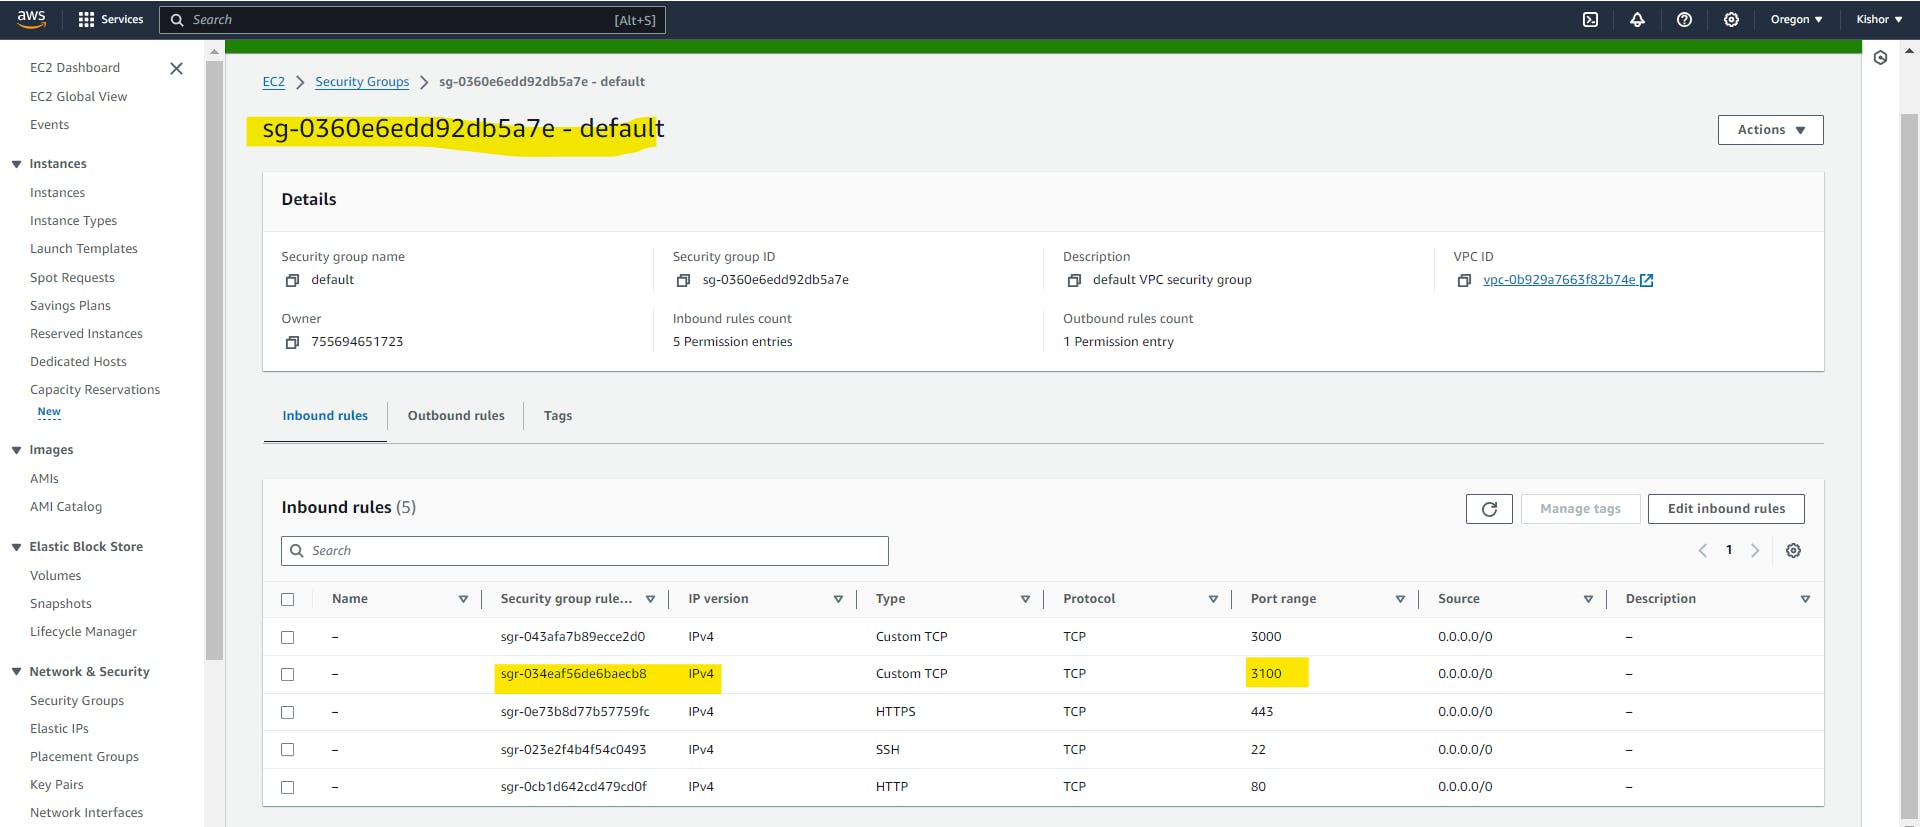
Step 4: Enable the port 3100 in security group and verify container.
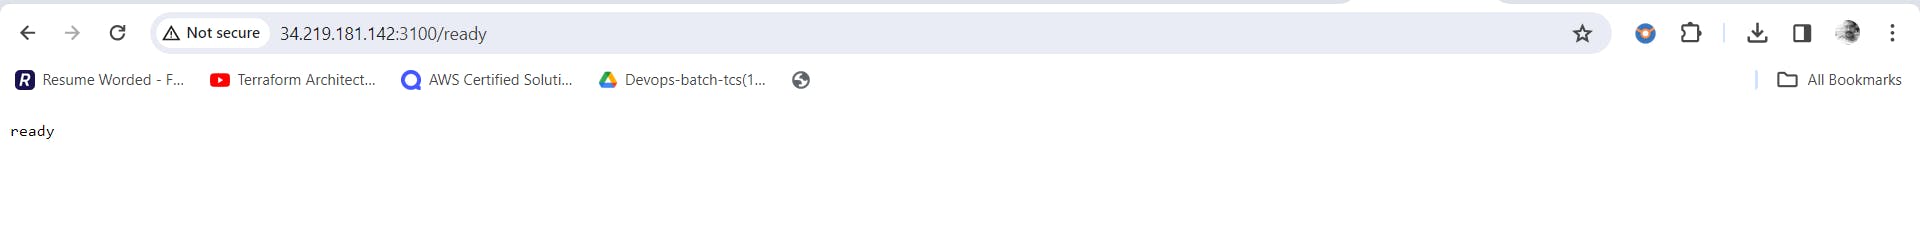
To check Loki readiness open a browser and visit https://<public-ip>:3100/ready to confirm Loki's readiness.
Verify Loki Data Source Configuration
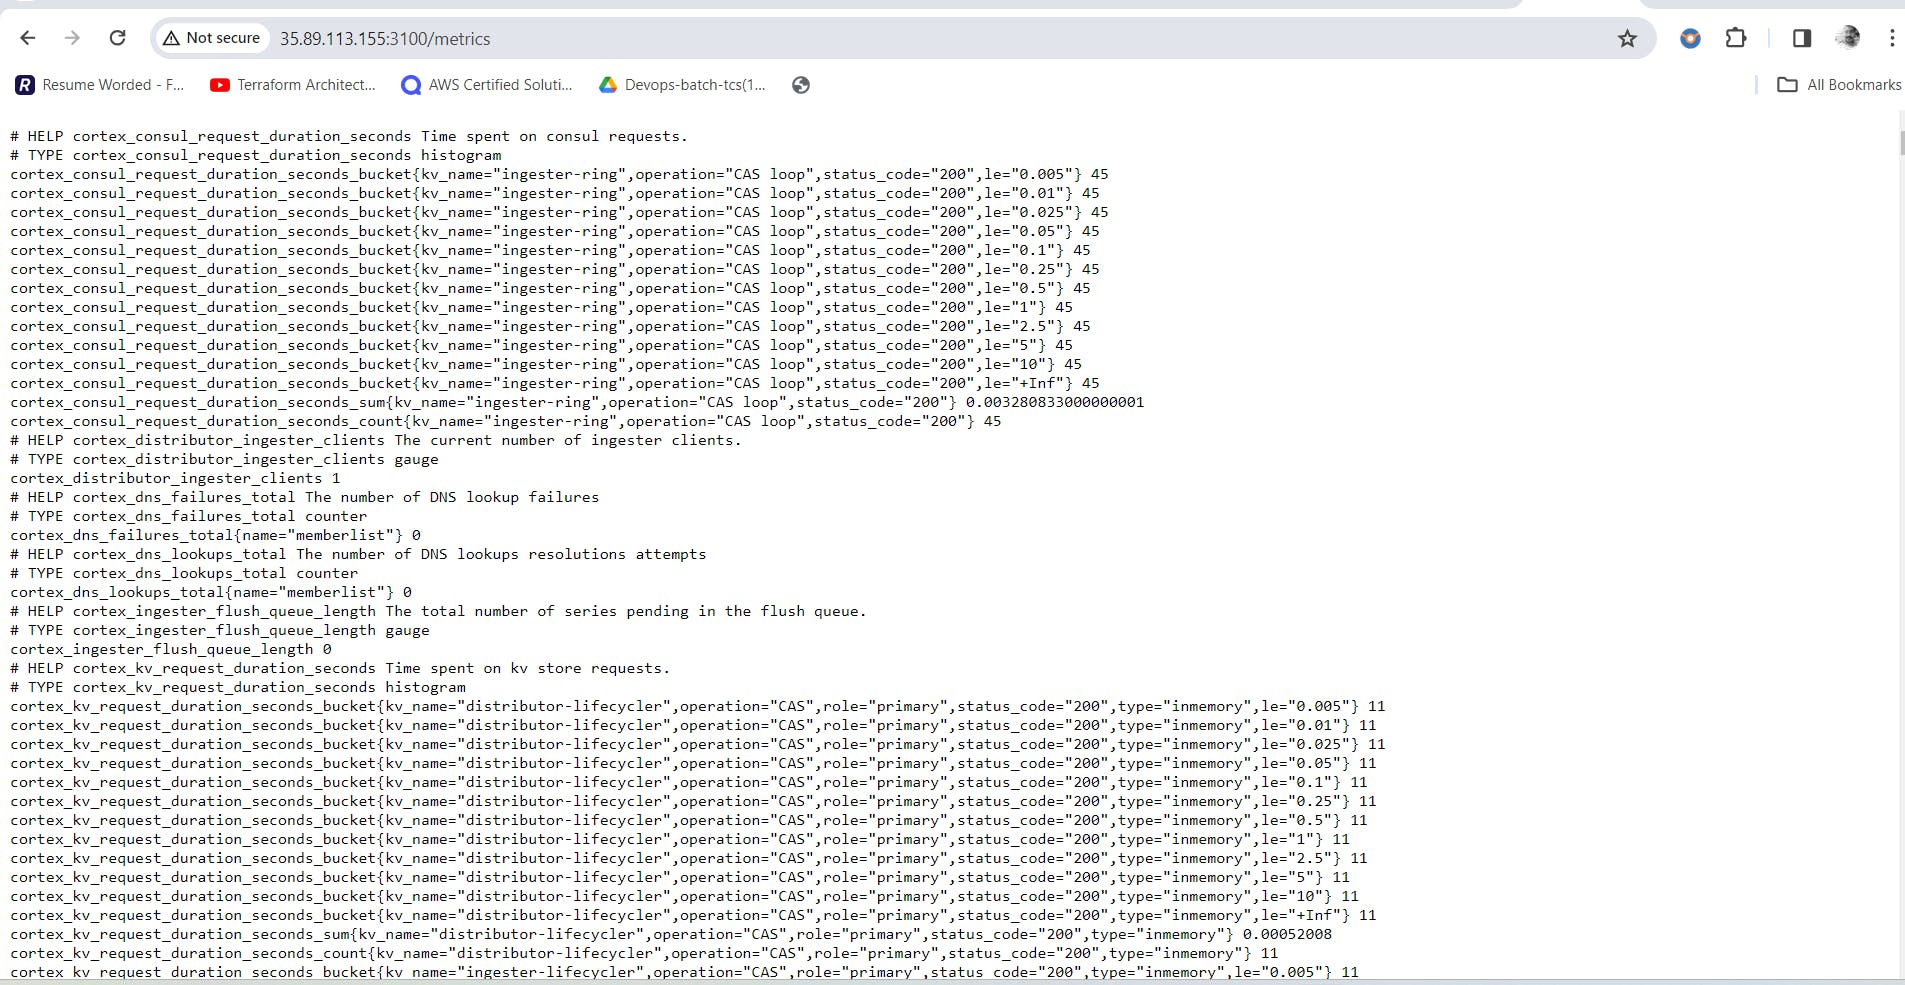
Before creating alerts, ensure that the Loki data source is added and configured correctly. Navigate to the "Settings" or "Data Sources" section in Grafana and confirm that Loki is configured to provide metrics.
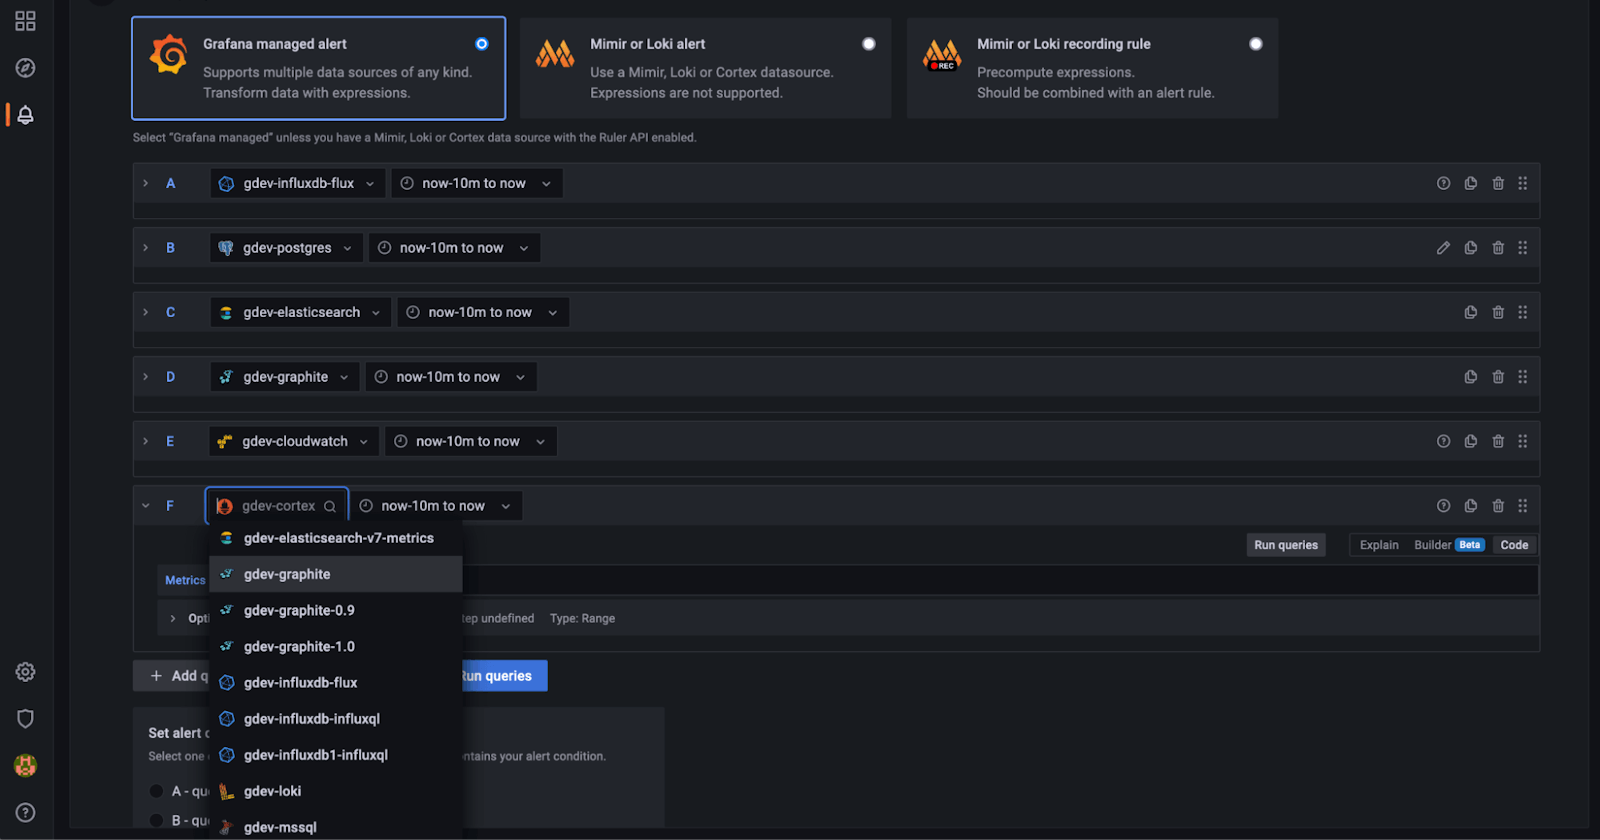
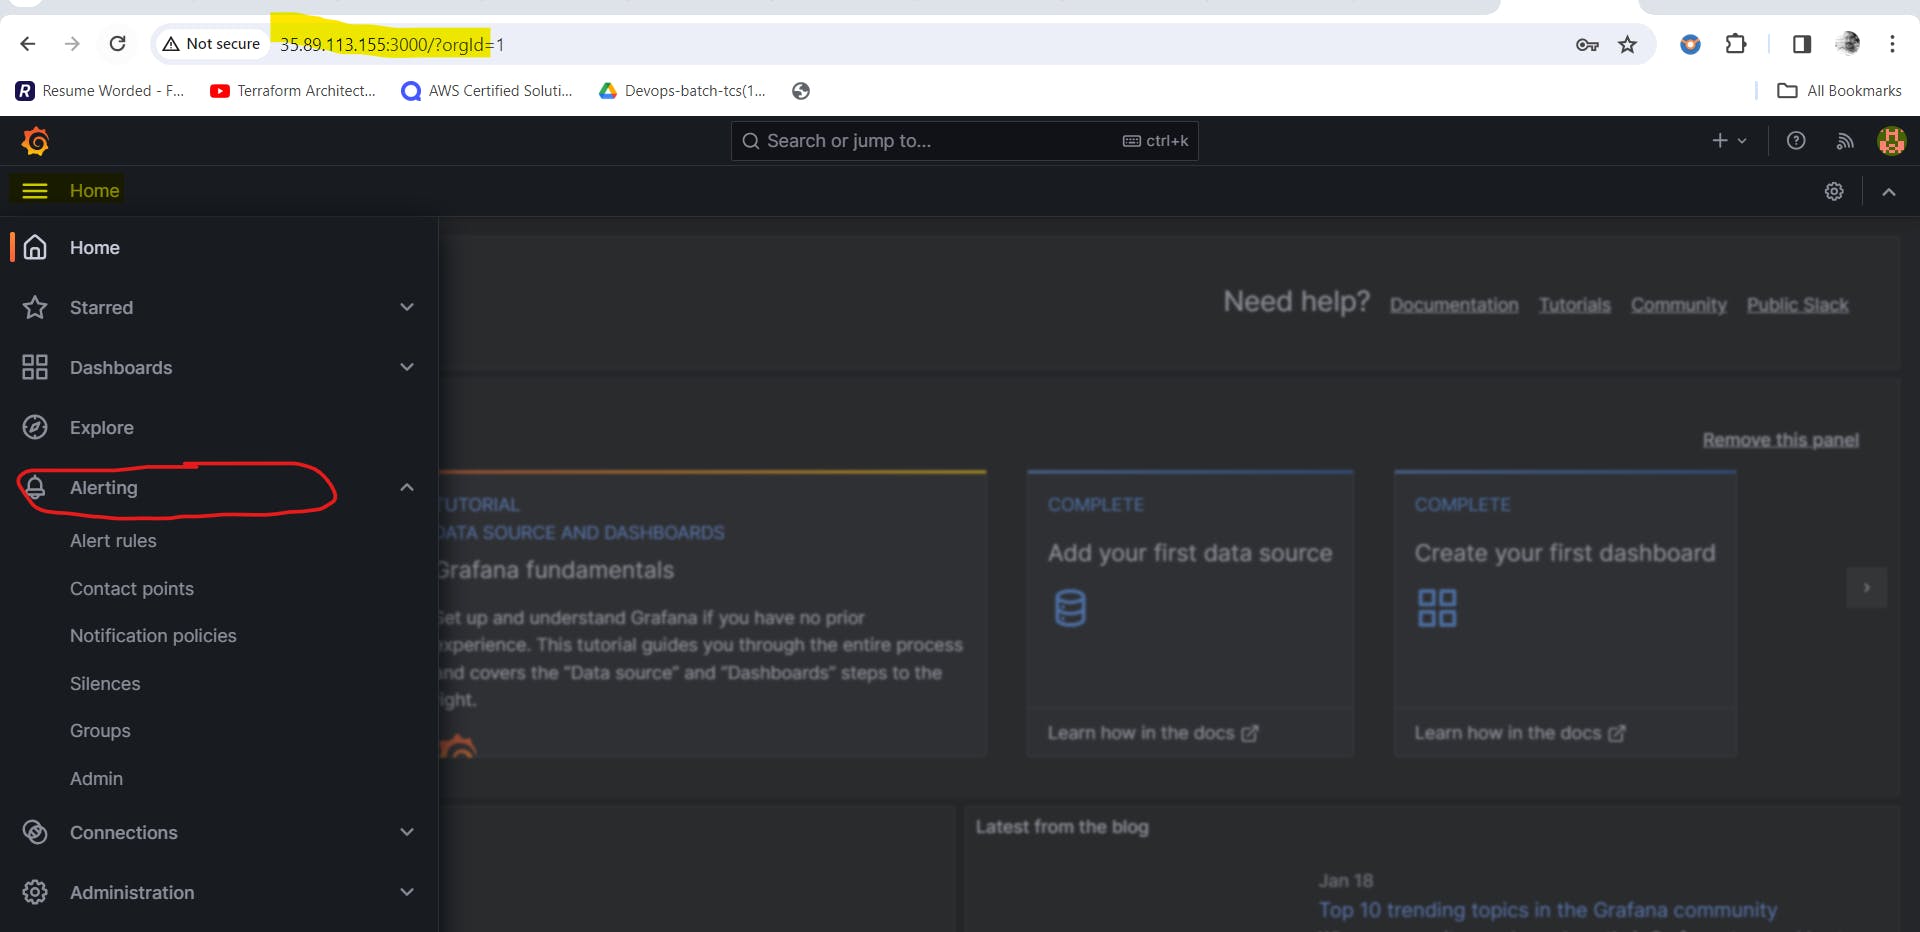
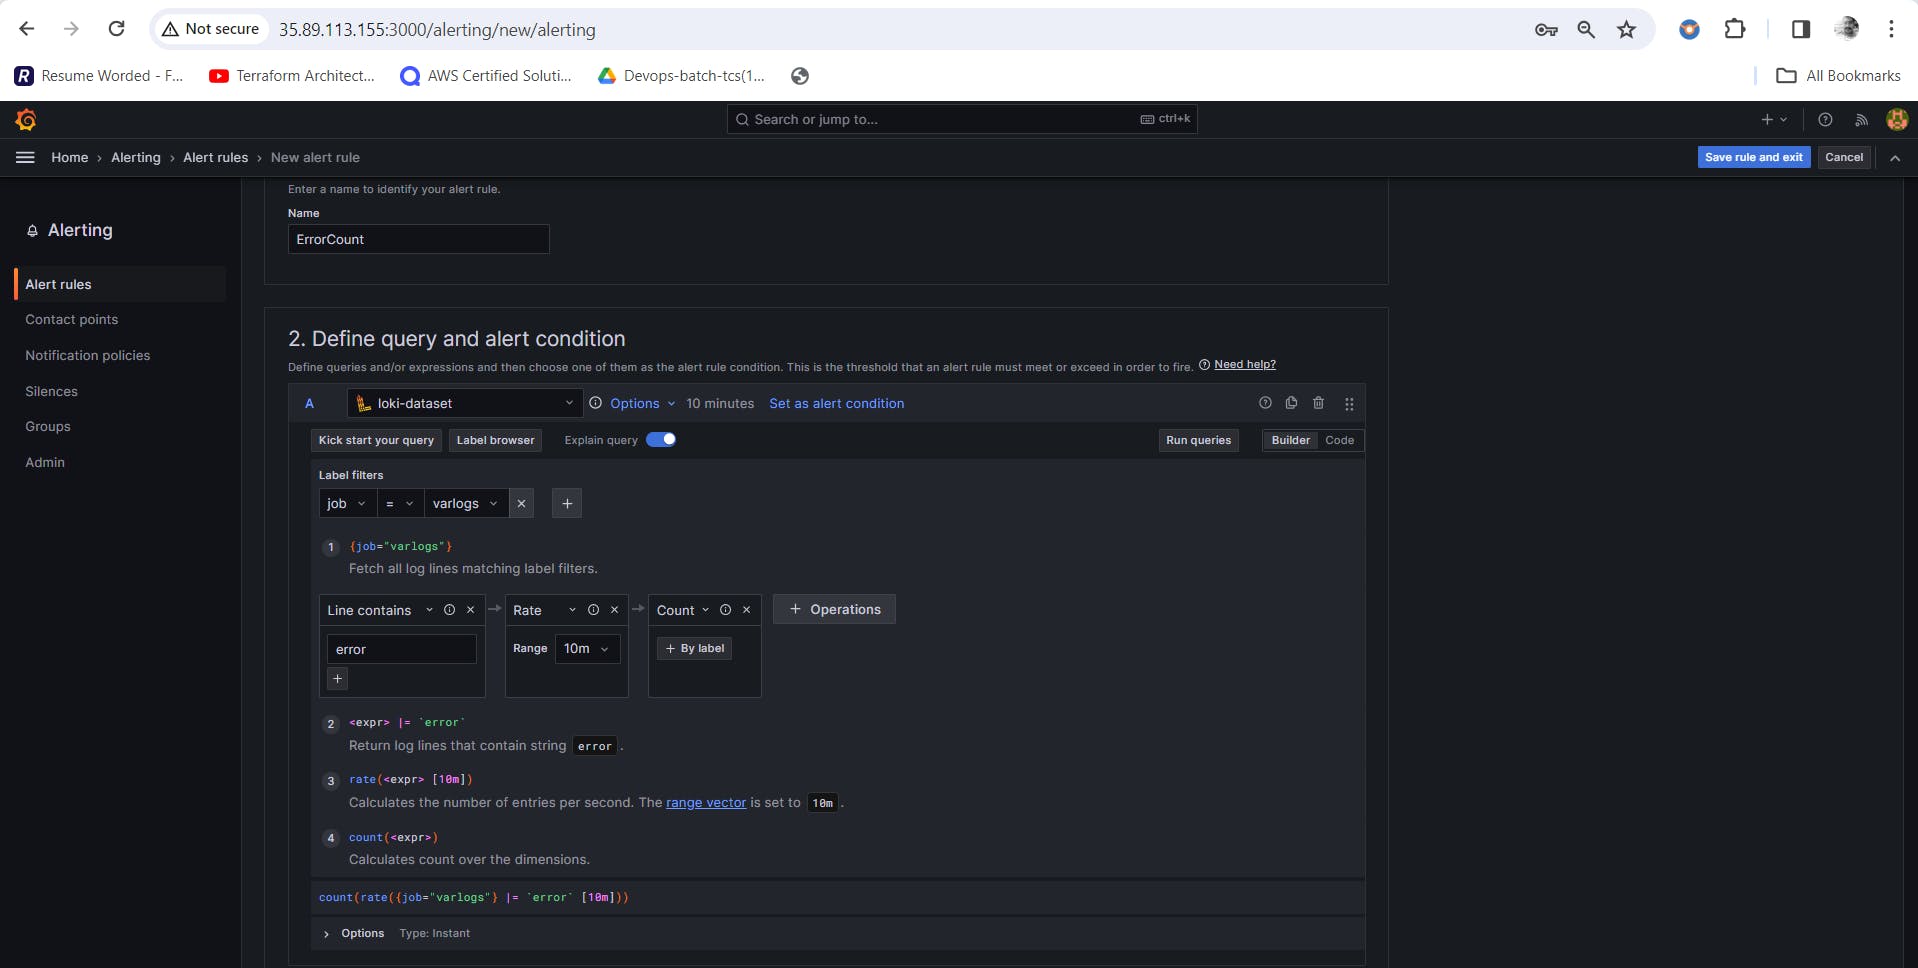
Setup Alerts in Grafana
On the left-hand side menu, locate and click on the "Alerting" section. This is where you can manage and create new alerts.
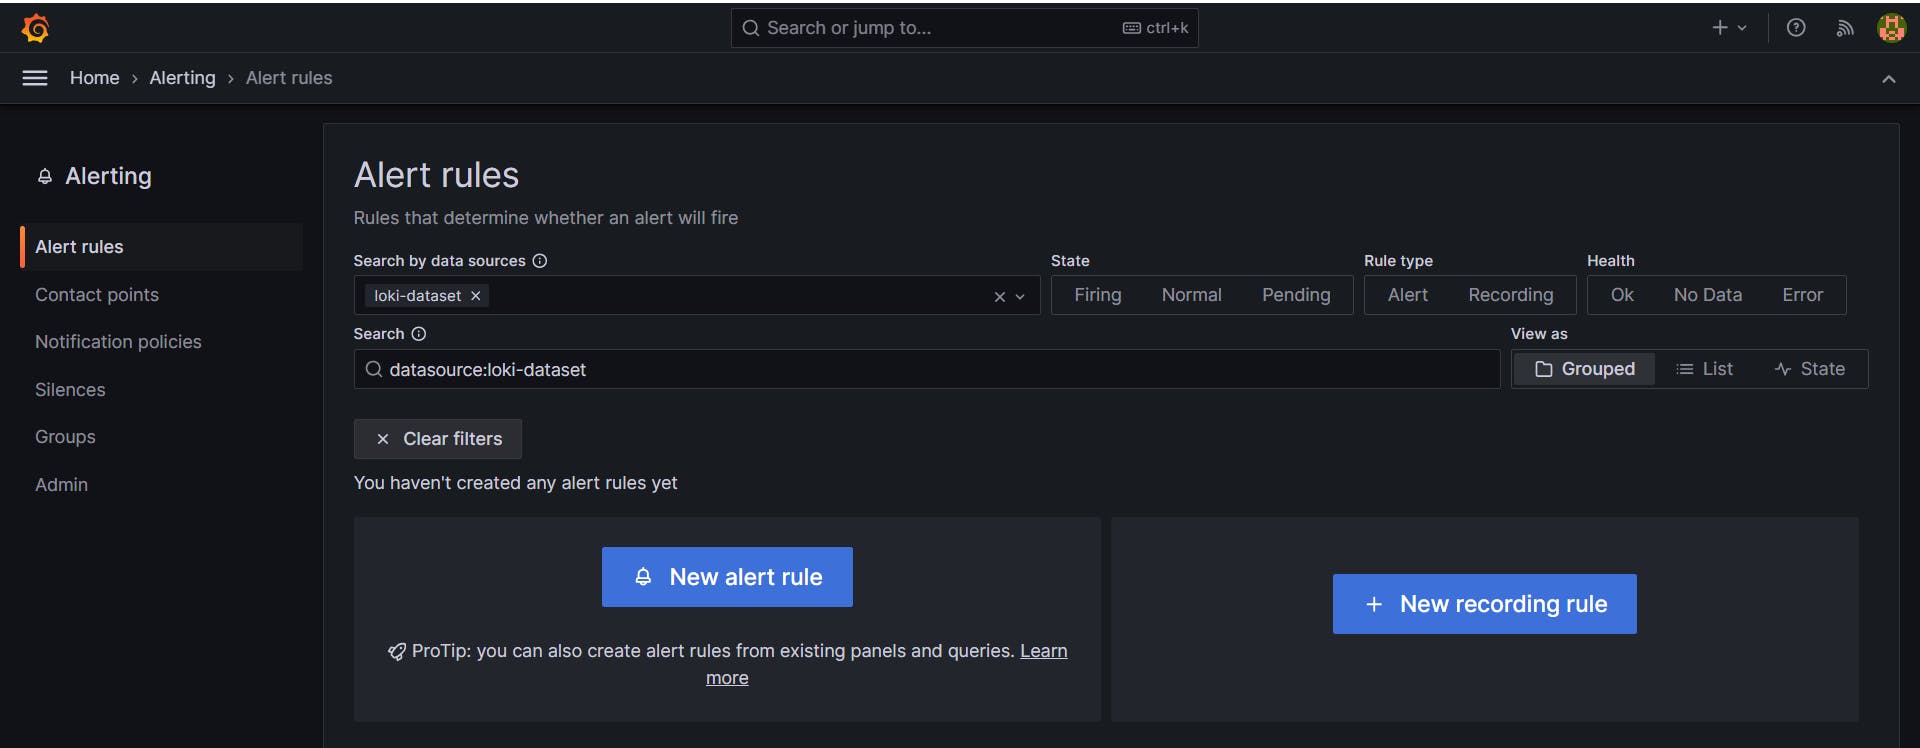
Within the Alerting section, click on the "Create Alert" button to initiate the process of setting up a new alert rule.
In our example, we used a query to monitor Error count.
Trigger the Alert for Testing
Testing involves deliberately creating a scenario that triggers the alert condition. For instance, intentionally misconfigure error occurs.
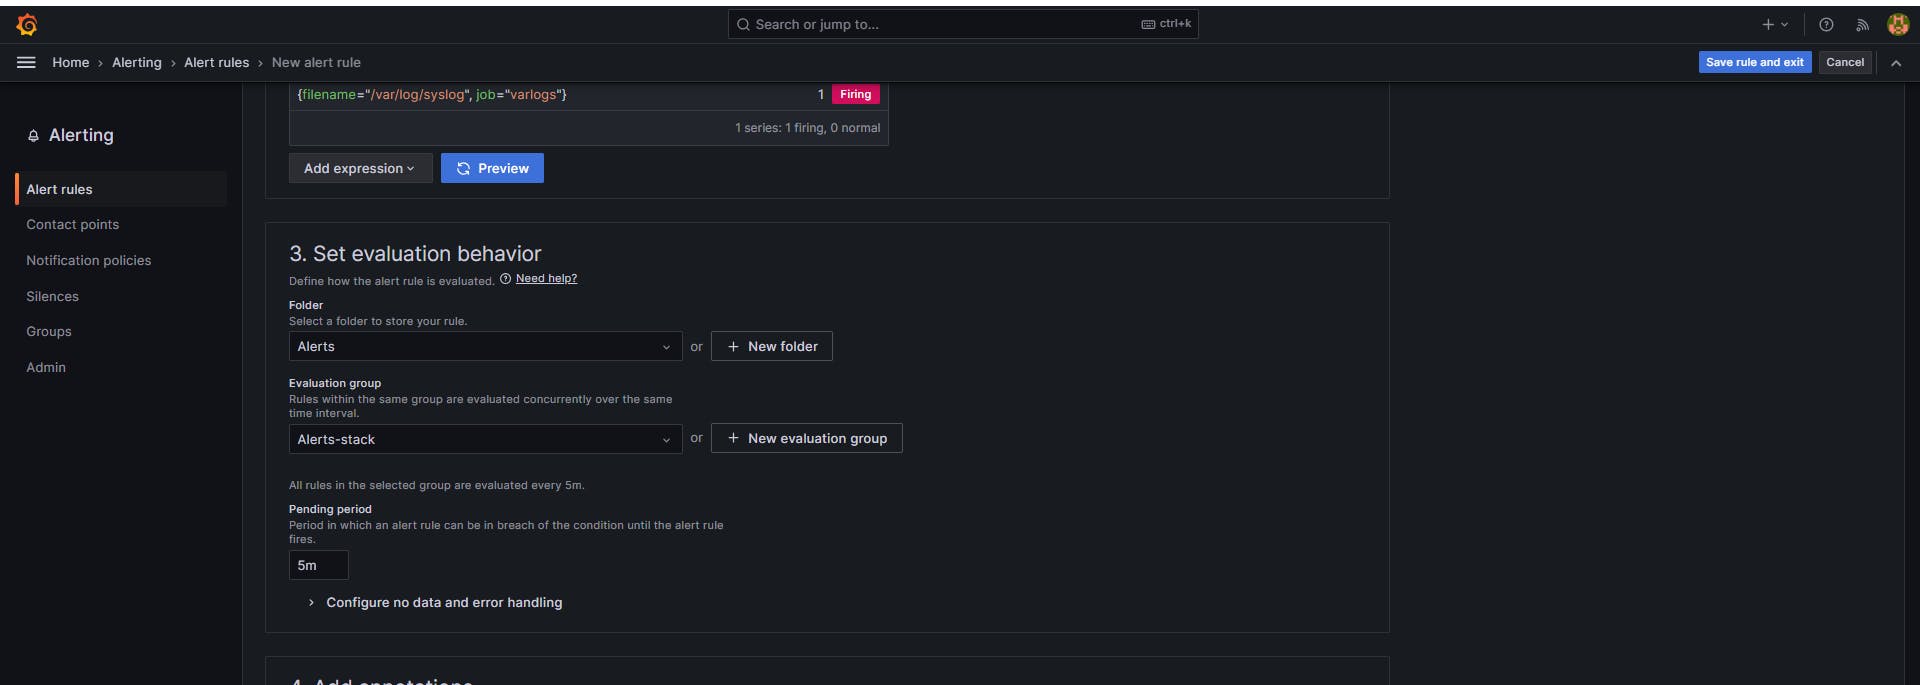
Monitor and Review
Wait for the evaluation interval to pass and monitor the "Alerting" section for the status of your error count alert. Check the configured notification channels to verify that alerts are being sent.
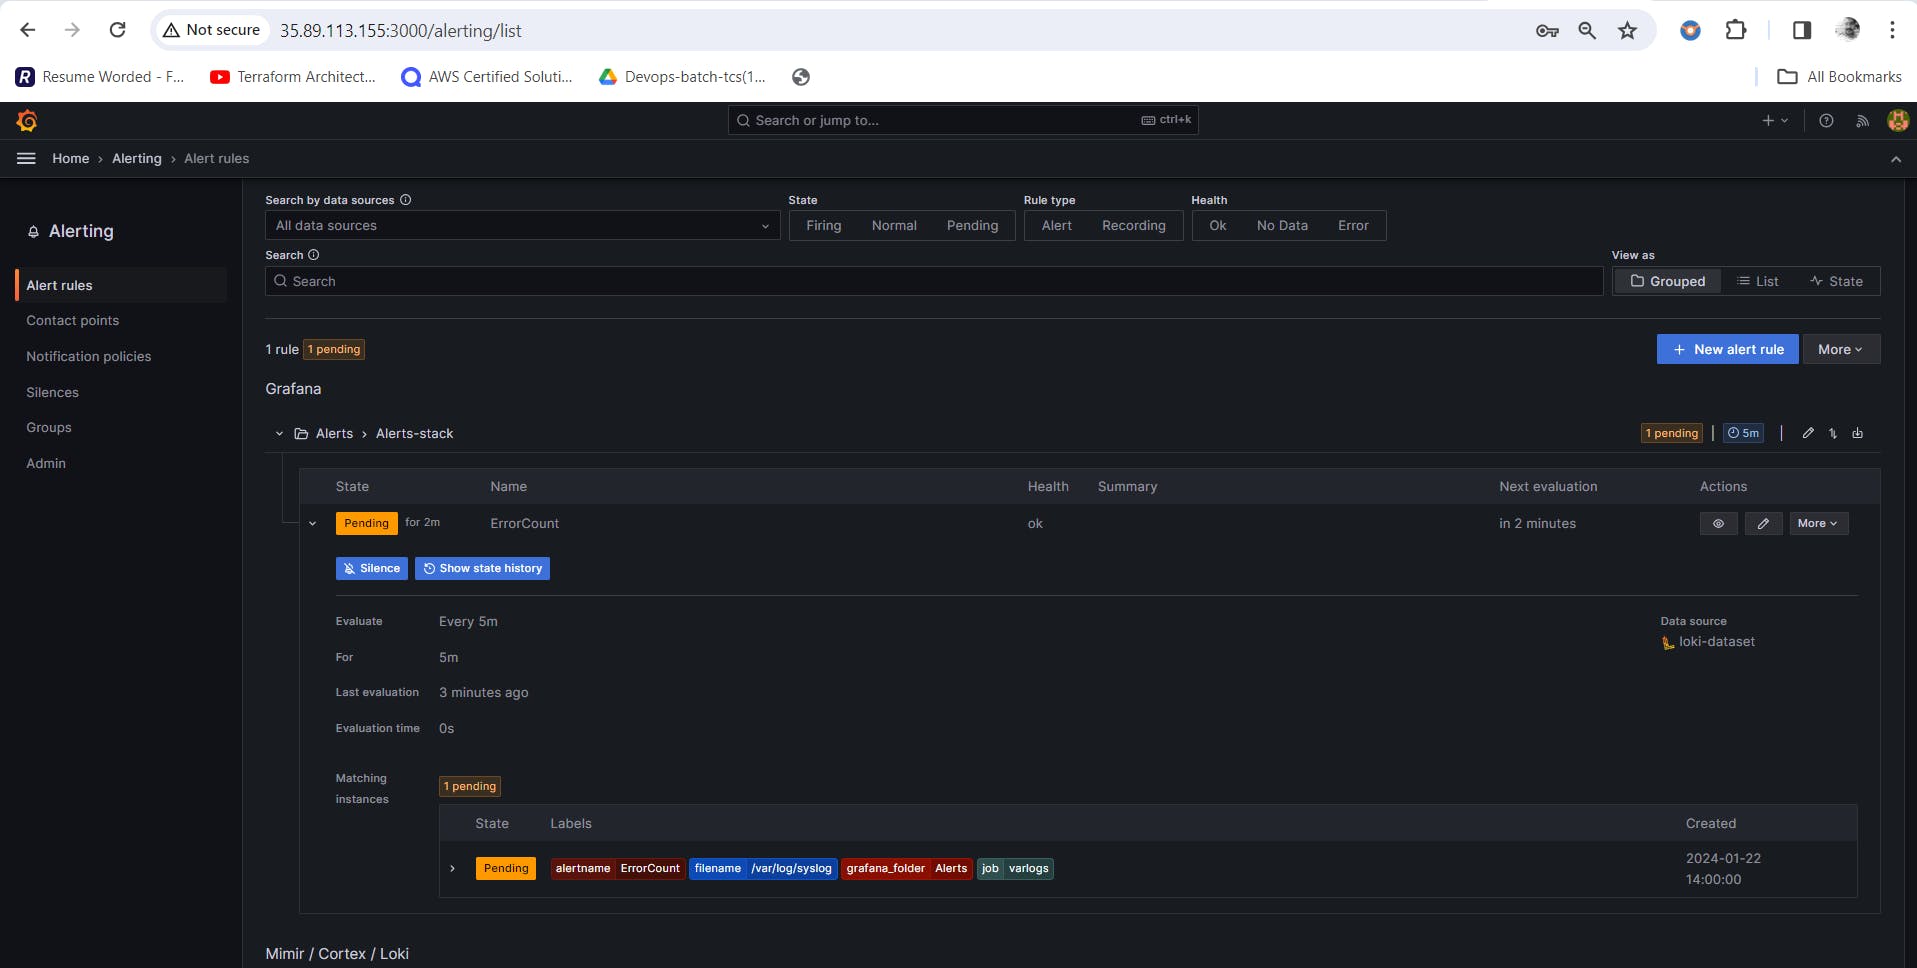
Alert triggered successfully..!
Happy reading..
Thanks,
Kishor Chavan