Connecting EC2 with Grafana
In the last article, we have learned How to set up Grafana in our local environment. Now, let's do one step ahead.
Task:
Connect an Linux and one Windows EC2 instance with Grafana and monitor the different components of the server.
For solution we need Loki and Promtail.
What is Loki and Promtail?
Loki is a log aggregation system designed for horizontal scalability, effectively storing and indexing log data. It serves as the central repository for swift and distributed log processing.
Promtail, on the other hand, is a nimble log collector that functions on individual servers or containers. It gathers log data from diverse sources by tailing log files or streams and subsequently transmits the information to Loki for storage and analysis.
Solution
Step 1: Launch 2 ec2 instance for windows and Linux server.

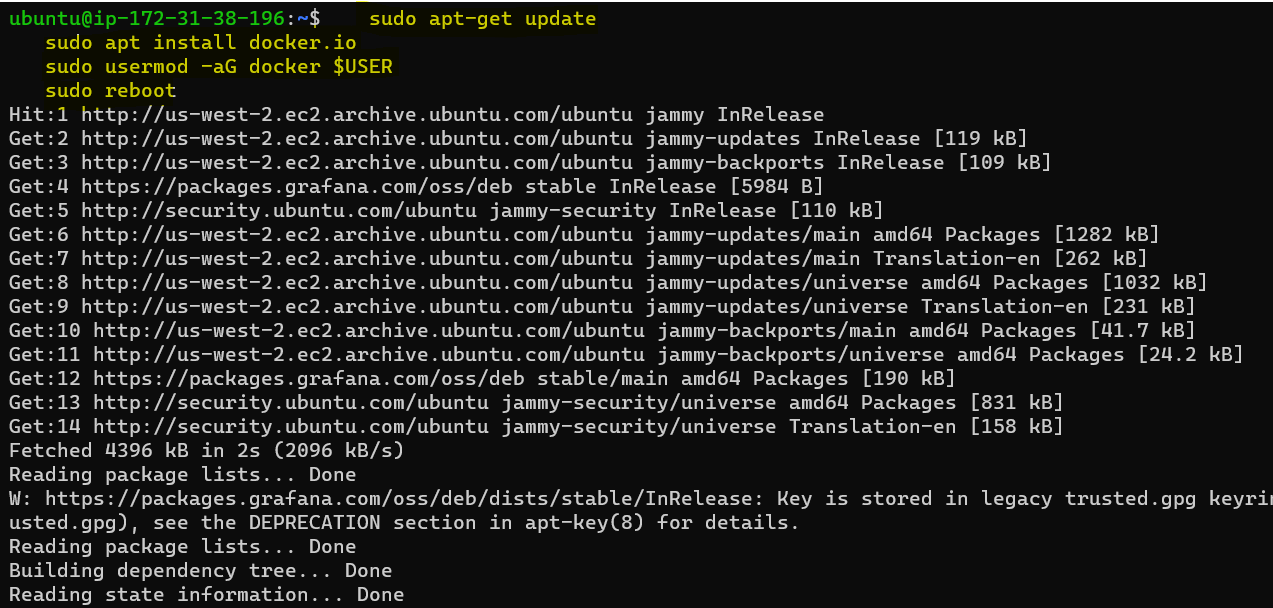
As perquisite we need to Install docker on grafana instance.


Step 2: Lets Install Loki and promtail on grafana server using docker container.
for Loki we need to download config file with below command
  mkdir grafana_configs
  cd grafana_configs
  wget https://raw.githubusercontent.com/grafana/loki/v2.8.0/cmd/loki/loki-local-config.yaml -O loki-config.yaml

same way we can download config for promtails.
  mkdir promtail_configs
  cd promtail_configs
  wget https://raw.githubusercontent.com/grafana/loki/v2.8.0/clients/cmd/promtail/promtail-docker-config.yaml -O promtail-config.yaml

Will run docker container for both loki and promtail
Loki
sudo docker run -d --name loki -v $(pwd):/mnt/config -p 3100:3100 grafana/loki:2.8.0 --config.file=/mnt/config/loki-config.yaml

Promtail
sudo docker run -d --name promtail -v $(pwd):/mnt/config -v /var/log:/var/log --link loki grafana/promtail:2.8.0 --config.file=/mnt/config/promtail-config.yaml

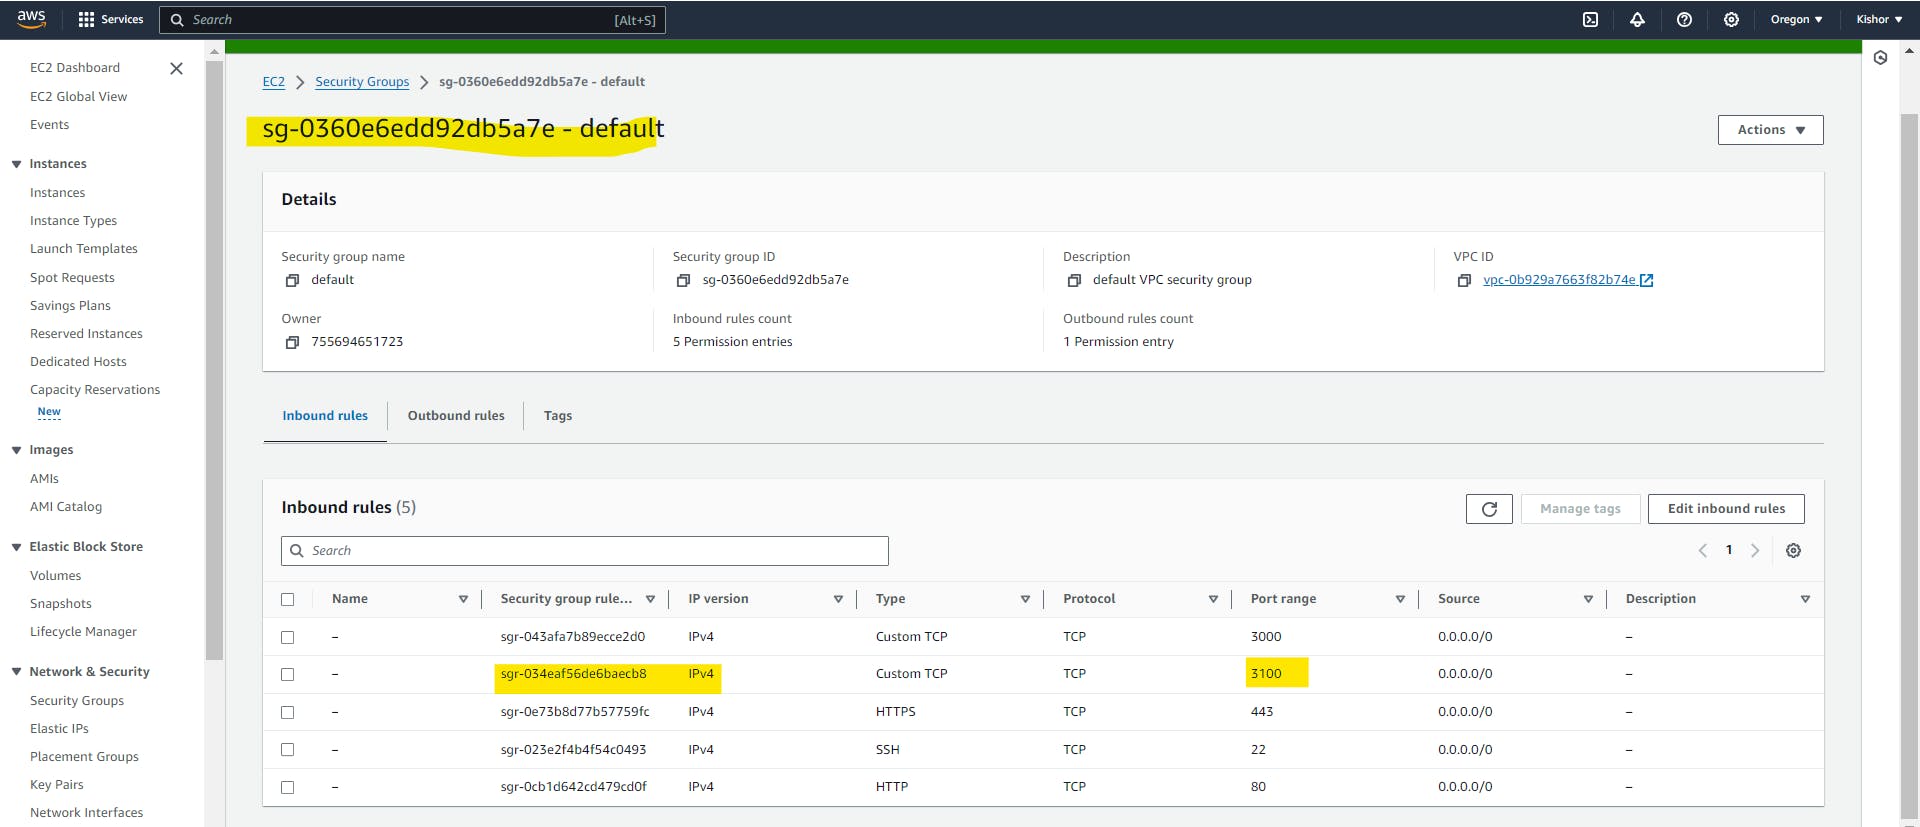
Step 4: Enable the port 3100 in security group and verify container.

To check Loki readiness open a browser and visit https://<public-ip>:3100/ready to confirm Loki's readiness.

Step 5: Setting Up Grafana Data Source
Log in to your Grafana web interface.->"Data Sources" > Add data source as "Loki"
Enter the Loki server URL, typically in the format http://:3100.


Next, click on the "Explore view" link. Under the 'Label filters' option, select 'job' and 'varlogs'. Click on "Run query", and you'll see all your system logs displayed on the dashboard

This method allows us to monitor logs on Grafana, utilizing Loki as the data source and Promtail as the data retrieval mechanism. It's a powerful way to observe and analyze logs within Grafana's dashboard interface.
In the panel, once again choose 'job' and 'varlogs' under 'label filters'. Search for error counts by adding a filter in the 'Line contains' section. Next, select 'Range functions' and 'Rate' from the 'Operations' menu and Sum

Post saving visual we can see final output like this

So concluded that, Grafana is an incredibly user-friendly tool that allows us to effortlessly craft visually appealing and impactful dashboards for various needs. Loki and Promtail play a crucial role by capturing, storing, and providing logs to Grafana, enabling comprehensive visualization and analysis.
Thanks for reading
Thanks,
Kishor Chavan